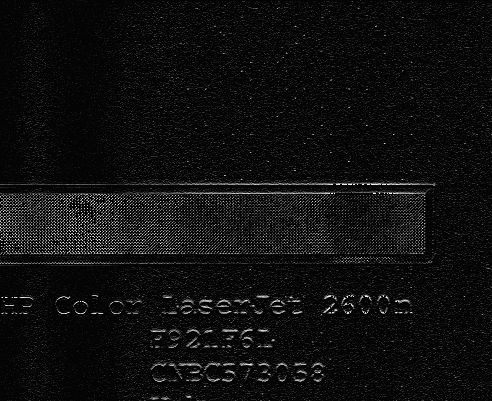
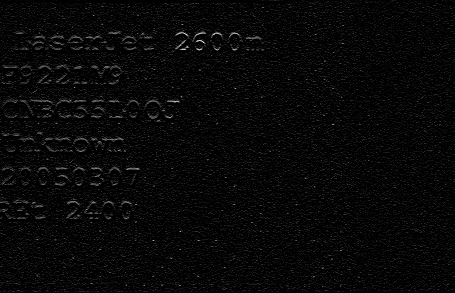
There was an inquiry for full-page scans in case people want to help out with the analysis. I would be totally stoked if people were interested and wanted to get involve. The pages are scanned at 1200 dpi and thus they are very large. I store them in .TIF with .ZIP post-processing–I’m guessing you don’t want them compressed with a lossy algorithm like JPEG because you may end up spending most of your time dealing with compression artifacts. Hosting 100 megs of data on this site is out of my bandwidth reach, but fortunately, there’s bittorrent. This is my first time ever creating a torrent, but I’m hoping this file is all you’ll need to start downloading two partial-page scans in full color. Let me know if this is broken somehow.
For those of you who have Matlab, I had some luck playing around with a couple of image processing toolboxes and some Wavelet transforms using the haar basis. Below is a script that will generate the images you see at the bottom of this post:
RGB = imread('Image024.tif');
gray2 = 0.2989*RGB(:,:,1) + 0.5870*RGB(:,:,2) + 0.1140*RGB(:,:,3);
imagesc(gray2);
colormap(gray);

[thr,sorh,keepapp] = ddencmp('den','wv',gray2);
% De-noise image using global thresholding option.
grayd = wdencmp('gbl',gray2,'sym4',2,thr,sorh,keepapp);

subplot(211), colormap(gray), imagesc(gray2)
subplot(212), colormap(gray), imagesc(grayd)

[C,S] = wavedec2(grayd, 2, 'haar');
cH2 = detcoef2('h',C,S,2);
cV2 = detcoef2('v',C,S,2);
imwrite(cH2,gray,'cH2.tif','tif');
The results aren’t stunning, but the dots are definitely getting close to a machine-recognizeable point. I’m thinking the next thing to do is to specify a gridding parameter on the image with a stride equivalent to the watermark code’s dot frequency. Then, break down the image into an array of pixels and do a pixel energy count or a small FFT to find high frequency content. These counts can then be thresholded to make a 1-0 decision. It’d be nice to automate this process, because I heard that the EFF has about 200 sample pages printed out.
Below are some results of the above script:


Details so far –
The dots seem to be on a 36×36 pixel grid, Given that the scans are at 1200 DPI, that makes the dot grid 0.03 inches.
The dot pattern seems to be 23 dots vertical, 18 dots horizontal, which is 414 bits of information.
More to come soon – oh, and the pattern seems to be subtely different based on where it is on the page.
Very interesting! thanks for sharing this information. curious that the watermark changes depending on where they are on the page. Do you think it could be due to problems with the scanning process?
Let me know if there are any experiments you’d like to see run, such as printing successive pages on the same printer. I will try and use a pattern that contains more white space so that the prints contain more watermark data. thanks!
Turns out that it seems to be errors in the scanning process, although they were placed exactly in the right places and the right shape to be dots.. Can’t be sure though. They only showed up in 2 of the several [partial] pattern instances that I looked at.
However, it _definitely_ does change between pages. There still are some things in common, IE – recognizable geometric shapes and such, but ~1/2 the pattern is different. [~8 of the 23 lines]. Another note is that the 8 lines are not contiguous, IE, there were a few lines with identical data, which leads me to think that only a few fields have changed. Thats good news for us because if it was encrypted in any meaningful manner [besides xor] you would expect to see more modifications to the pattern.
There is of course a chance that the unchanged lines are simply registration marks to allow for alignment of the pattern, but thats more than half the pattern, and it seems like a waste of space.
Re experiments, I would be interested in performing a scan with the blue lighting, and a scan without blue lighting without changing the orientation of the page – I think that could be a powerful technique for helping analyze the image as it would give us a good picture of what are not dots. Another idea might be to modify the scanner to hang the lcd bar over the back of the page, the dots might register better with transmissive lighting rather than reflective lighting.
And large white areas are good, although I shudder to think of the file sizes we’ll get from that. To save space, we might consider somehow stripping the blue channel from the file as its mostly all saturated.
Also, an interesting experiment would be to scope + log those diff pairs on the frontend board while printing separate identical sheets. Comparing the logs could yield info about where the dot algorithm is located [IE, in the engine or in the frontend].
Just a followup to what I posted before,
I’ve got ~3/4 of the patterns mapped by hand, but because of the lack of large white spaces on the image I can’t map certain parts with 100% certainty.
If anyone wants my gimp images [various layers from different sections, all aligned /w a grid + filled in bitmasks], post a comment afterwards, and I;ll pass em on. I need to hunt down my webhost before I can post it online.
I’d love to see the images, or at least the parts you can map out–or the final results for the binary pattern in some format.
I’m posting another set of scanned images, three consecutive pages printed and scanned. It’s actually a bit difficult to re-scan the pages in white light because it requires me to take apart the scanner and re-fit the CCFL tube, which could lead to subtle changes in the orientation of the page (although, I guess I could tape the page onto the scanner..hmm…maybe I should try that next). The posting is on the main blog…
r
m
I couldn’t understand some parts of this article More Fun with Watermarks, but I guess I just need to check some more resources regarding this, because it sounds interesting.
Hello – you could get the CCFL and the LED to turn on where you want by instead of giving them power trough flexible wires, run some kind of power bars trough the scanner. You’d need 3 (or 2 if you leave a cable for ground) and just let the CCFL get power in the “calibration” part, the LED bar in the “image” part.